What Are the 5 Key Performance Indicators in Construction?

Published by Adeel Virk
Adeel is a founder & project manager at Virk Construction Management, delivering ethical, high-quality residential and commercial projects in NSW and Canberra.
Every construction project begins with a plan. It has a budget, a timeline, a quality standard, and a safety target. But a plan alone does not deliver a building. What keeps the work aligned with the plan is measurement, and that is exactly where key performance indicators (KPIs) come in.
In construction, KPIs are not abstract business concepts borrowed from corporate management theory. They are practical, site-specific metrics that tell a project manager whether the work being done today is on track with what was agreed weeks or months ago. For clients and builders across Canberra, NSW, and the ACT, understanding these metrics is one of the clearest ways to protect a project from the two most common failures: going over budget and running past deadline.
This post covers the five most important KPIs used in construction project management, what each one measures, and why it matters to the people responsible for the outcome.
Why Construction Projects Need KPIs?
The construction industry in Australia operates under real financial and legal pressure. A project that runs 10% over budget or 6 weeks behind schedule does not just cost money. It can affect occupancy permits, financing conditions, subcontractor relationships, and client trust.
According to research from KPMG and other project management bodies, a significant portion of construction projects globally miss either their budget, their schedule, or both. The most common reason is not poor workmanship or bad weather. It is the absence of structured, ongoing performance measurement during execution. Teams rely on experience and judgment when what they actually need is data.
KPIs provide that data. They convert vague impressions, such as "we are a bit behind," into specific numbers that can drive a targeted response.
The 5 Key Performance Indicators in Construction
1. Cost Performance Index (CPI)
The Cost Performance Index is the most widely used financial KPI in construction management. It measures how efficiently a project is spending money relative to the value of work actually completed.
The formula is straightforward:
CPI = Earned Value / Actual Cost
A CPI of 1.0 means the project is spending exactly as planned.
A CPI above 1.0 means the team is completing more work than expected for the money spent, which indicates good cost efficiency.
A CPI below 1.0 signals that the project is spending more than the value it is producing, which is a warning sign of cost overrun.
For example, if a construction team has completed work worth $200,000 (earned value) but has actually spent $240,000 to get there, the CPI is 0.83. That gap of $40,000 between what was spent and what was earned needs immediate attention, because unchecked it compounds across every subsequent phase.
The CPI works best when it is tracked per phase rather than across the whole project at once. A residential project in Canberra might show a healthy CPI during the slab and frame stage but a declining one during fit-out, pointing directly to where cost control needs tightening.
2. Schedule Performance Index (SPI)
Time is construction money, but schedule slippage is often more damaging than the daily cost it adds. Delays affect subcontractor sequencing, material delivery windows, financing draw schedules, and in many ACT and NSW projects, regulatory permit expiry dates.
The Schedule Performance Index measures progress efficiency against the planned timeline:
SPI = Earned Value / Planned Value
An SPI of 1.0 means the project is exactly on schedule.
An SPI above 1.0 means work is progressing faster than planned.
An SPI below 0.95 is generally treated as a threshold that requires active intervention.
The SPI is particularly useful when combined with the CPI, because a project can appear to be saving money while actually falling behind schedule. That combination often means work is simply not being done rather than being done efficiently. Tracking both metrics together gives a complete picture of project health.
For developers and homeowners managing builds through Virk Construction Management's project approach, schedule adherence is built into the oversight structure from the start, not added as a reporting layer after problems emerge.
3. Defect Density Rate
Quality in construction is not just about aesthetics. It is about structural integrity, compliance with Australian Building Code requirements, and the long-term performance of the finished asset. Defect density rate measures the number of defects identified per unit of work completed during inspection.
This KPI is calculated across inspection stages, not at handover. Tracking defects at the frame stage, pre-lining stage, and pre-handover stage gives a much more granular view of where quality is slipping than a single end-of-project inspection ever could.
High defect density in early phases is an indicator of workmanship issues that will become significantly more expensive to fix once walls are lined, and finishes are applied. In the ACT and NSW, where building compliance is enforced through mandatory inspection hold points, a high defect rate can also delay the Certificate of Occupancy.
Understanding how to assess workmanship quality on-site connects directly to what the Virk Construction Management blog covers on checking wall flatness, which is exactly the kind of on-site quality check that feeds into defect density tracking before finishes go on.
4. Safety Incident Rate (TRIFR)
The Total Recordable Injury Frequency Rate (TRIFR) is the standard safety KPI used across Australian construction. It measures the number of recordable injuries per million hours worked.
TRIFR = (Number of Recordable Injuries x 1,000,000) / Total Hours Worked
Safe Work Australia reports that the construction industry consistently records one of the highest rates of serious injury and fatality among all Australian industries. In the ACT and NSW, Work Health and Safety obligations under the Work Health and Safety Act 2011 require principal contractors to actively manage and report safety incidents.
Beyond compliance, safety performance directly affects project cost and schedule. A recordable injury triggers a mandatory investigation, often a work stoppage, subcontractor review, and possible regulator inspection. A single lost-time injury can disrupt a project schedule by days or weeks while also exposing a contractor to financial liability.
The TRIFR is not just tracked; it is managed through pre-start meetings, hazard identification, and toolbox talks that happen before problems occur. Projects that track this KPI proactively typically record lower incident rates because the act of measurement reinforces accountability across the workforce.
5. Resource Utilisation Rate
Every construction project has a planned allocation of labour hours per task and per phase. The resource utilisation rate measures how efficiently those hours are being used against the work output produced.
This KPI is calculated as:
Resource Utilisation = Actual Output / Available Capacity x 100
A utilisation rate consistently above 90% can indicate that the team is stretched too thin, increasing the risk of errors and fatigue. A rate below 70% suggests that resources are idle, which adds cost without adding progress.
For projects involving subcontracted trades, which covers most residential and commercial construction in Canberra and NSW, this metric is particularly important. Trade sequencing on a construction site is interdependent. If a concreter is idle because the formwork subcontractor is behind, the resource utilisation rate drops, the schedule slips, and the cost increases.
Resource utilisation tracking often sits behind the scenes compared to cost and schedule KPIs, but it is one of the clearest leading indicators of upcoming delay. By the time the SPI drops to 0.90, the utilisation problem that caused it has typically been present for two or three weeks.
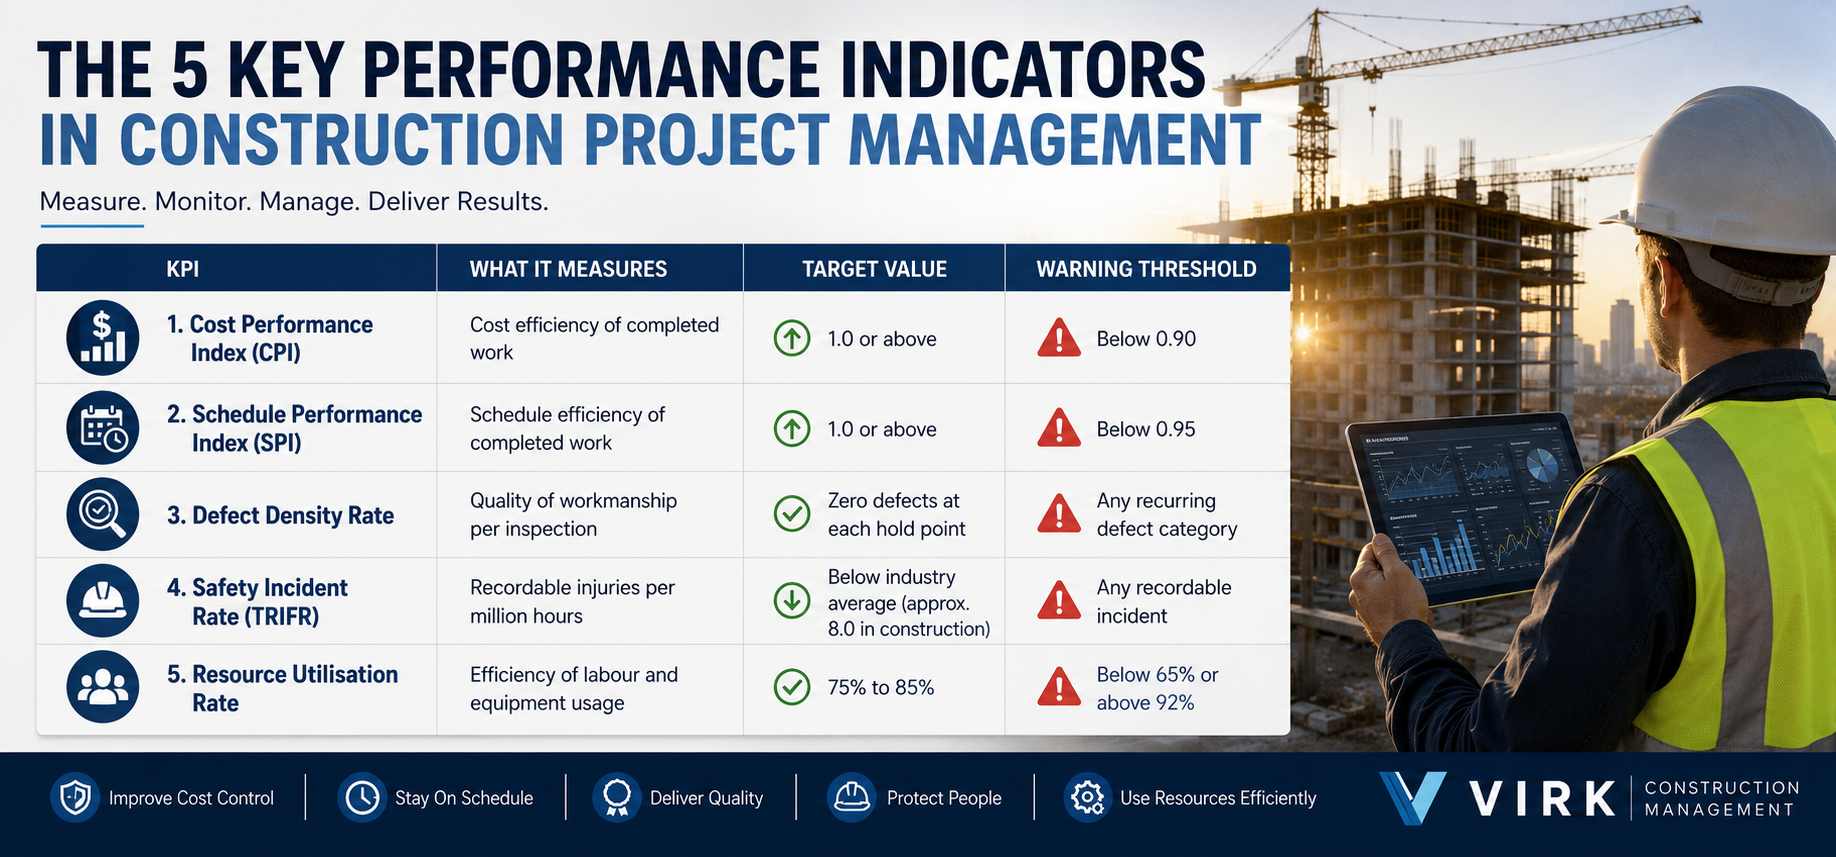
KPI Reference Table
How These KPIs Work Together?
Looking at any single KPI in isolation gives an incomplete picture. A project with a CPI of 1.05 looks financially healthy, but if the SPI is 0.88 and defect density is rising, the cost efficiency is being purchased at the expense of schedule and quality, which will catch up in the final stages.
The most effective approach treats these five indicators as a connected dashboard rather than five separate reports. When the CPI and SPI both fall below 1.0 simultaneously, that is a signal of fundamental execution problems, not just a bad week on-site. When the TRIFR rises alongside a declining resource utilisation rate, it often indicates workforce pressure affecting both safety and productivity.
For context, the cost management approach used under a cost-plus contract in NSW directly affects how the CPI is calculated and reported, since all actual costs are transparent to the client.
A Note on KPI Frequency
One of the most common mistakes in construction management is treating KPIs as a reporting exercise rather than a management tool. Project teams pull figures at the end of each month, note the variances, and move on. By that point, the problems those numbers represent are already two or three weeks old.
The CPI and SPI should be reviewed at least weekly during active construction phases. The TRIFR is updated after every incident, not monthly. Defect density is checked at every mandatory inspection hold point defined under the National Construction Code. Resource utilisation is most useful as a daily or weekly operational metric, not a monthly summary.
The frequency of measurement determines whether a KPI can actually prevent a problem or can only explain one after the fact.
What This Means for Projects in Canberra and ACT?
The ACT construction environment has specific characteristics that affect how these KPIs behave in practice. Building Approvals and Certificate of Occupancy requirements under ACT legislation create hard compliance checkpoints that directly interact with defect density and schedule KPIs. A project that reaches a mandatory hold point with outstanding defects does not simply note them and move forward. Work stops until they are resolved, which affects the SPI and, subsequently, the CPI.
Labour availability in the Canberra region also affects resource utilisation more sharply than in larger metro markets. With a smaller subcontractor pool than Sydney or Melbourne, a trade delay caused by utilisation mismatch is harder to recover quickly, and the SPI impact tends to be more pronounced.
Understanding these local factors is part of what separates project management expertise from generic construction oversight. For clients considering new builds, renovations, or commercial fit-outs in the ACT region, the Virk Construction Management project portfolio shows how structured performance management applies across different project types and scales.
Ready to Discuss Your Project?
Whether you're planning a new build, fitout, refurbishment, or construction project, our team is here to help with practical advice, transparent pricing, and professional project management.